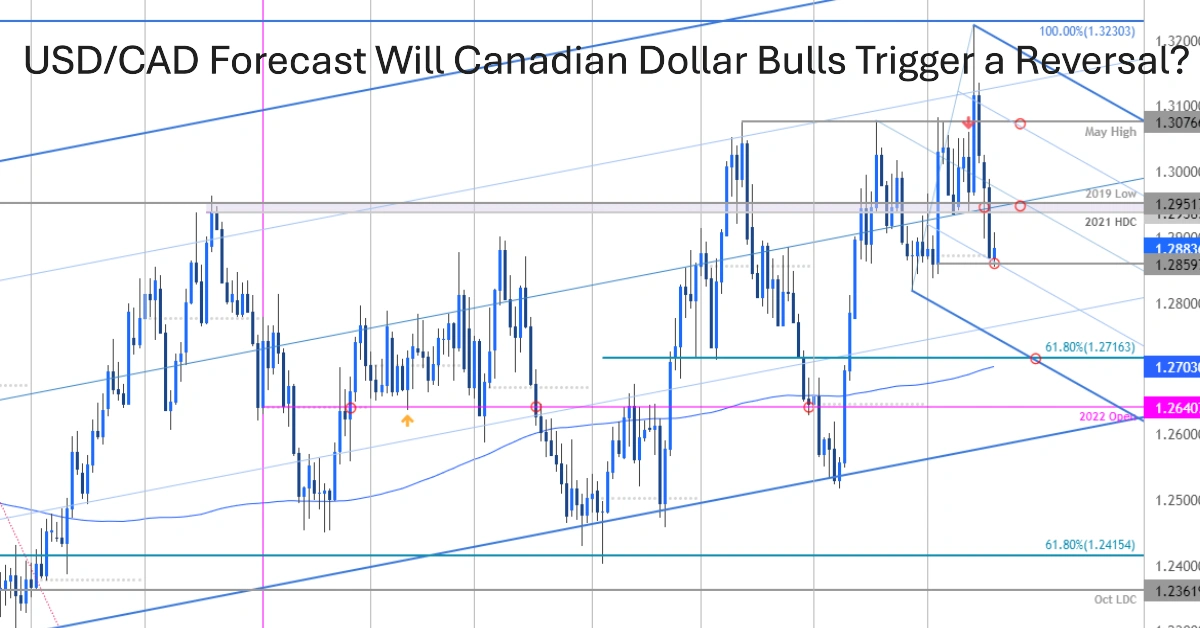
The Canadian Dollar gained ground early this morning after a softer U.S. CPI print sparked broad USD weakness. One of the immediate reactions was a dip in USD/CAD, which pushed to a fresh short-term lower-low, reinforcing the downtrend that has dominated since early 2025.
But while the short-term trend remains pointed lower, there are signs under the surface that suggest a potential counter-trend move may be brewing—at least temporarily.
Table of Contents
The Bigger Picture: Technicals Hint at Potential Reversal Setup
Daily Chart Signals: Falling Wedge and RSI Divergence
Despite the recent bearish action, USD/CAD has refused to break decisively through support. Instead, it’s forming a falling wedge pattern, which is typically a bullish reversal setup when appearing in a downtrend. Additionally, RSI divergence on the daily chart shows waning downside momentum—even as price sets lower lows.
These indicators don’t guarantee a reversal, but they do raise the probability of a near-term bounce, especially if support continues to hold.
USD/CAD Remains Trapped in a Decade-Long Range
Zooming out to the monthly chart, the pair remains well within its long-standing range between 1.4000 and 1.4500 on the upper end. These levels have consistently acted as psychological barriers and have rejected bullish advances multiple times throughout the past several years.
This year, sellers aggressively defended 1.4000, which marked the beginning of the current downside move. The inability to break above that level underscores how entrenched range-bound behavior still governs this pair.
A One-Sided Market: Why the Risk of Reversal Is Growing
Markets are moved by supply and demand, not simply by good or bad news. And right now, USD/CAD is showing classic signs of positioning imbalance:
- Bullish catalysts (like hawkish Fed comments or solid U.S. data) are failing to lift the pair.
- Bearish engulfing candles have appeared in succession, signaling strong selling pressure.
- Buyers may be tapped out, and without new demand, price can fall simply due to profit-taking and stop-outs.
This is likely why USD bulls were overwhelmed at 1.4000, and why sellers ran into headwinds at 1.3750 in May and again at 1.3650 in early June.
Short-Term USD/CAD Outlook: Still Bearish, But Caution on Breakout Chasing
Don’t Chase Price Near Support
While the dominant tone remains bearish, chasing fresh shorts this close to key support is risky. There’s simply less room for price to run without a bounce or consolidation. The smarter approach may be to wait for lower-high resistance to develop.
Key Resistance Zones to Watch
- R1: 1.3700 zone – Previously active short-term resistance.
- R2: 1.3728–1.3731 – Recent swing high that capped bounce attempts earlier this week.
- R3: 1.3750 – A major level that was support in May and flipped to resistance.
A break above all three could indicate a bullish breakout from the falling wedge, opening the door to a larger pullback. If that happens, other USD pairs—like EUR/USD—might offer cleaner bullish setups than USD/CAD.
USD/CAD Weakens Further Ahead of Bank of Canada Rate Decision
Bank of Canada Poised for June Rate Cut After April Jobs Shock and Rising Unemployment
What Mark Carney’s Victory Means for Future Bank of Interest Rate Cuts
Final Thoughts: Manage Risk, Don’t Predict
Forecasting exact market direction is notoriously difficult. Rather than trying to guess tops or bottoms, traders should focus on risk and trade management—the aspects they can control. In the current USD/CAD environment, a cautious, tactical approach makes sense:
- Watch for pullback opportunities instead of forcing new shorts.
- Be patient for lower-high resistance zones to develop.
- Avoid breakout chasing at the bottom of the range.
As always, monitor technical structure alongside broader macro narratives—especially when the USD narrative is shifting, as it seems to be following the latest CPI miss.

